A delivery bike every ≈2.0 minutes.
That is the estimated rate for Checkers Sixty60 delivery motorbikes on one residential street, 08:00 to 20:00, on the busiest of the most recent 36 recording days (26 Jun 2026 to 18 Oct 2026): 11 Oct 2026.
≈8 263 passes in 36 days (5 795 proven on camera) ≈230 on an average day (161 proven) ≈362 on the busiest, 11 Oct 2026 (273 proven)
Why every camera count is a minimum
- Nothing after dark is counted. Only full daylight hours count, to 18:00 or 19:00 depending on the season, but deliveries continue to about 20:00.
- Fast passes are missed. Bikes crossing quickly can blur and fail detection. The observed detection rate is 75% to 80%.
- Bikes riding together can count as one.
Estimates (marked ≈, striped or hollow) correct for these using the method in the seven-week evidence record. Over May to June 2026 that gave about 202 passes per full delivery day, against a proven average of 136.
Passes per day
26 Jun 2026 to 18 Oct 2026Proven on camera, 08:00 to 18:00 or 19:00 by season Estimated to 20:00 (modelled, not observed)
Selected day: 24 Jul 2026
≈190 estimated · 127 proven on cameraBy hour: every mark is one bike
24 Jul 2026, local timeProven on camera Estimated. From 18:00, the evening is modelled from the 17:00 hour.
Every bike seen on 24 Jul 2026
127 crossings, 08:00 to 18:00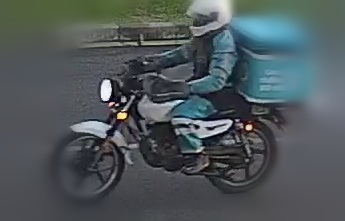
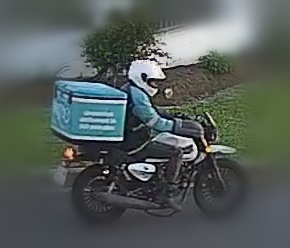
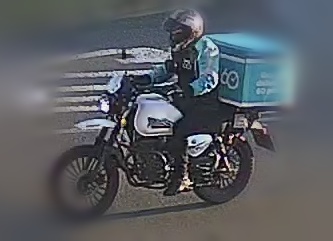
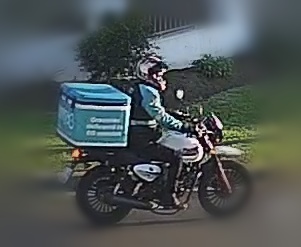
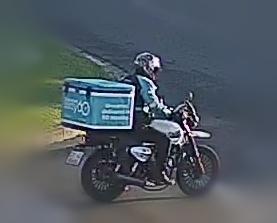
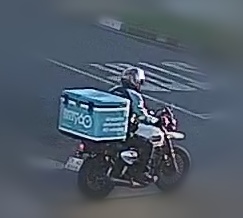
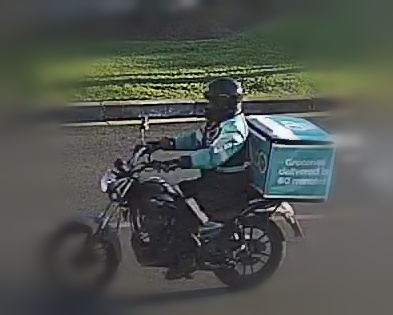
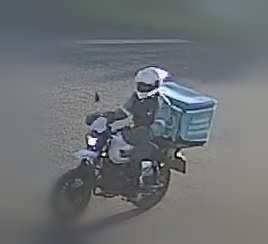
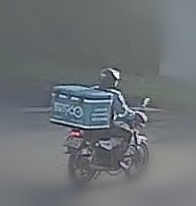
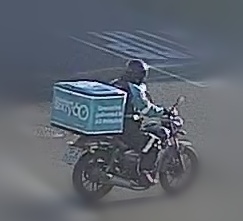
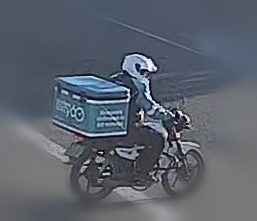
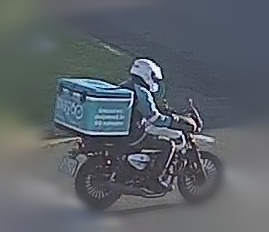
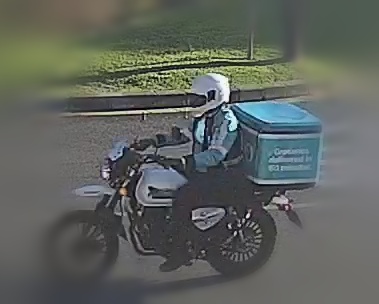
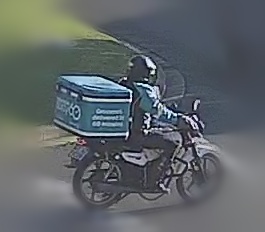
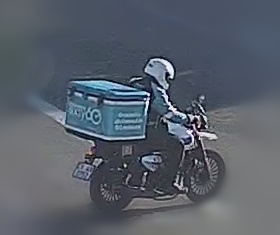
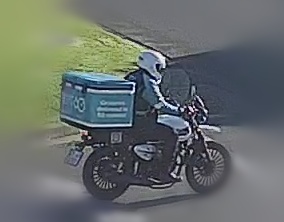
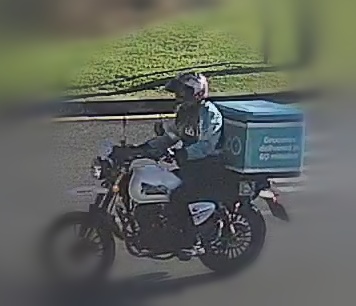
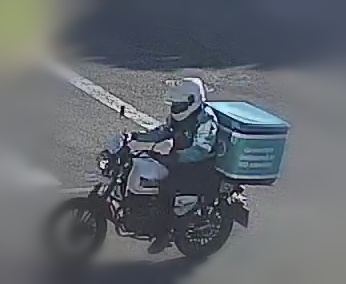
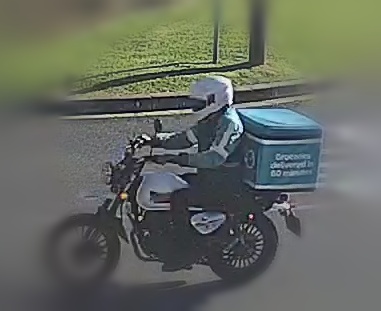
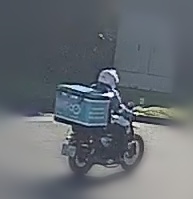
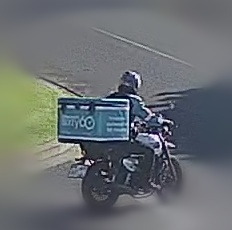
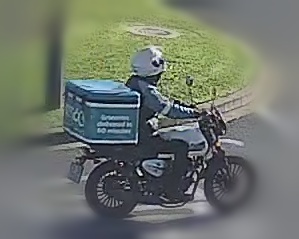
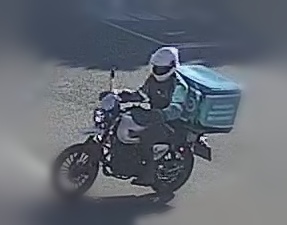
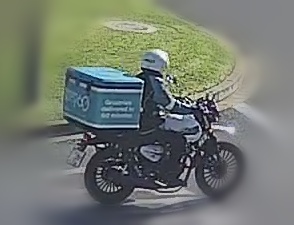
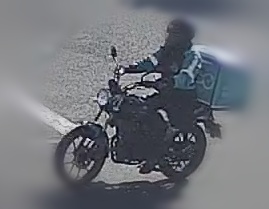
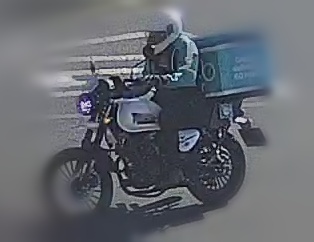
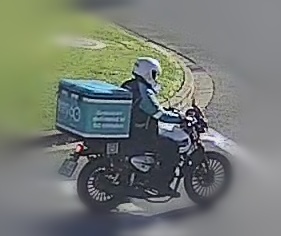
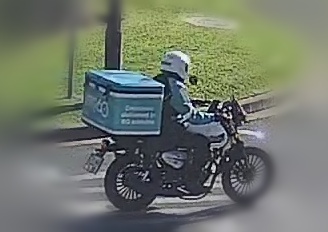
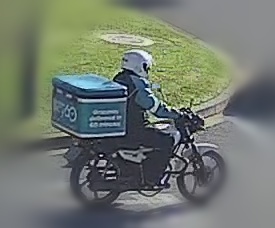
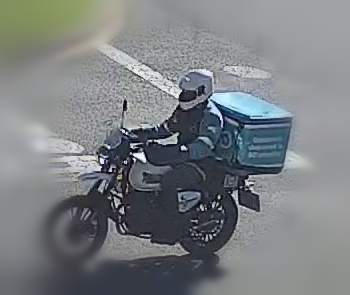
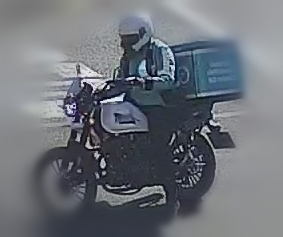
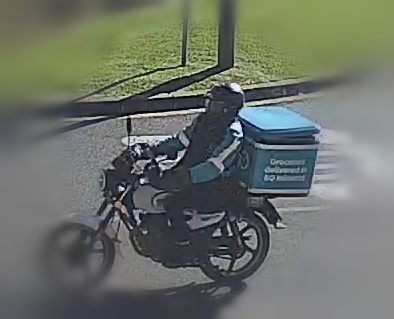
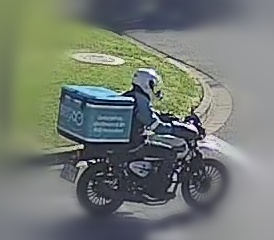
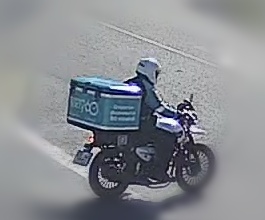
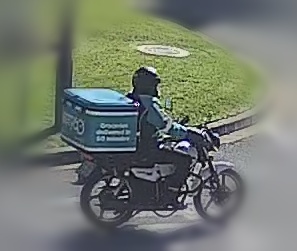
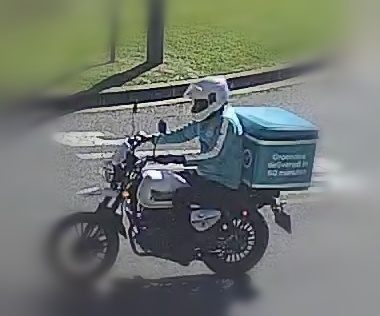
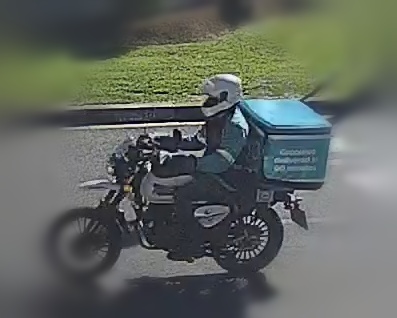
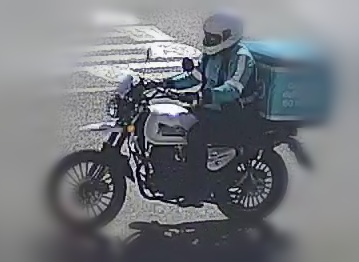
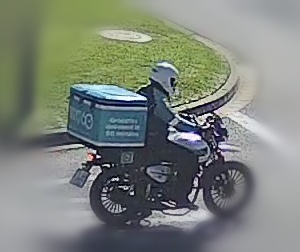
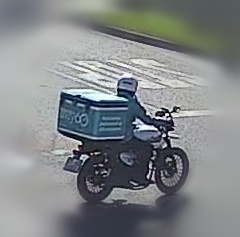
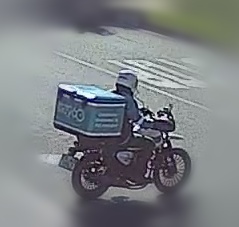
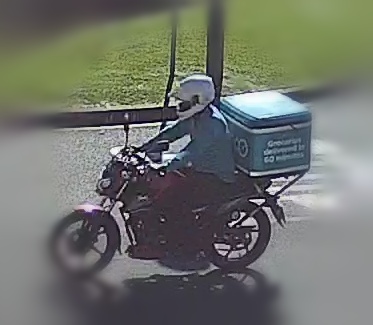
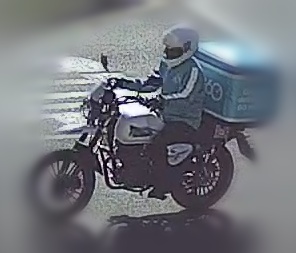
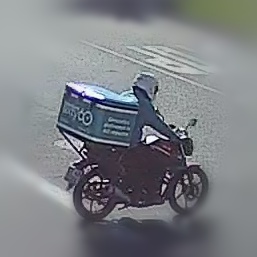
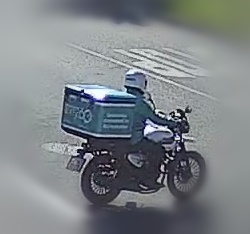
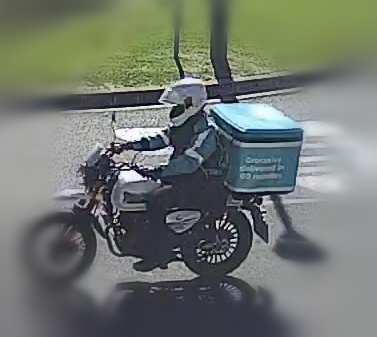
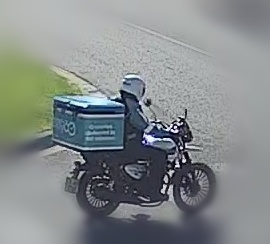
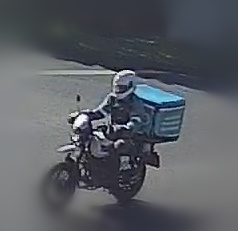
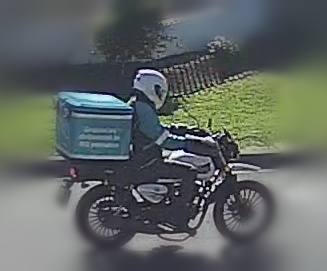
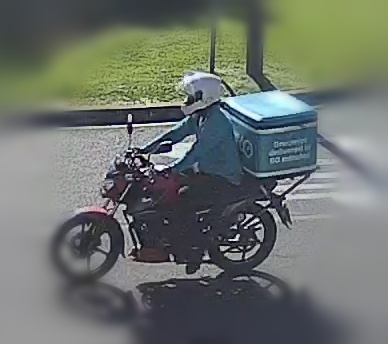
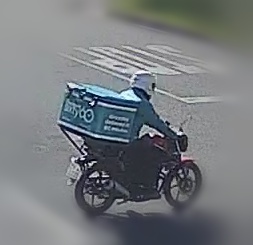
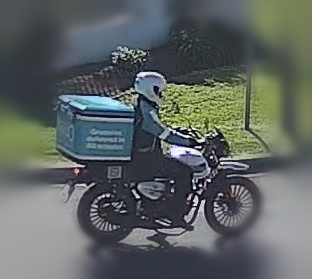
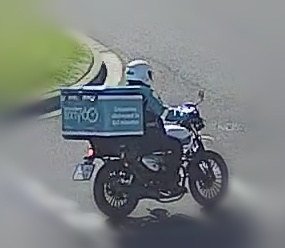
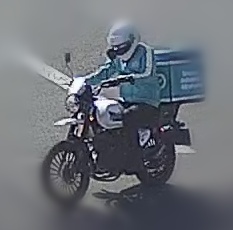
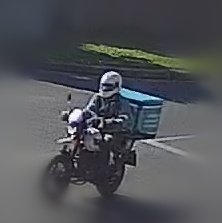
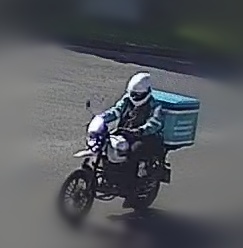
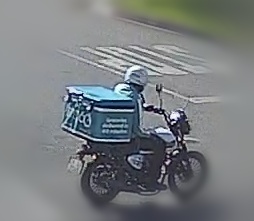
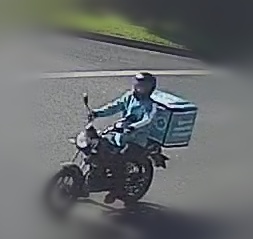
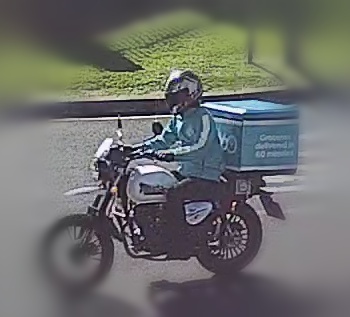
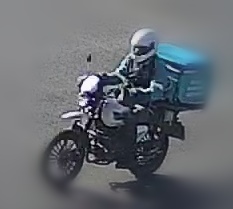
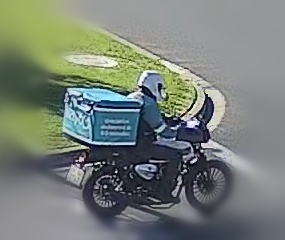
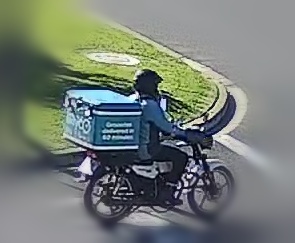
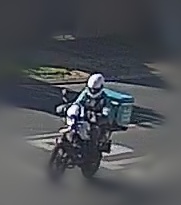
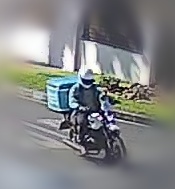
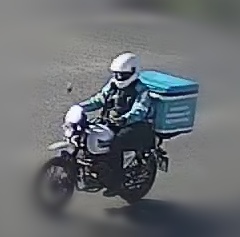
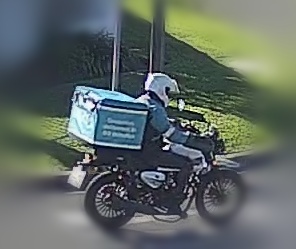
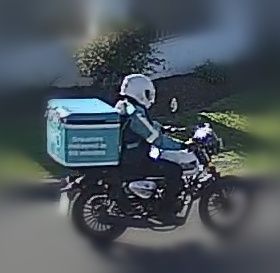
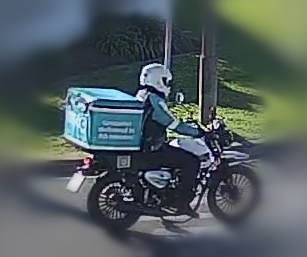
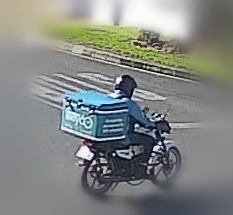
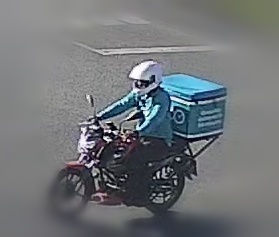
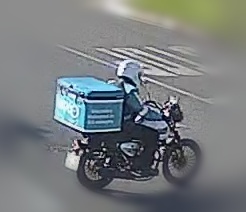
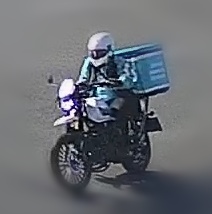
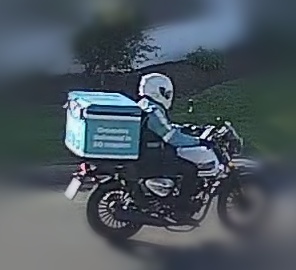
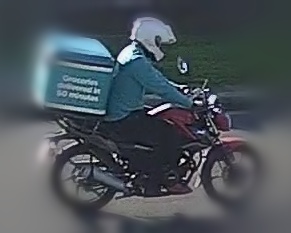
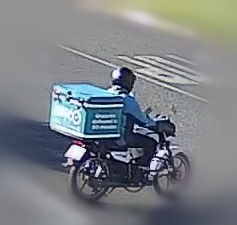
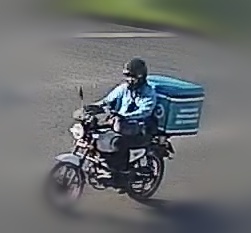
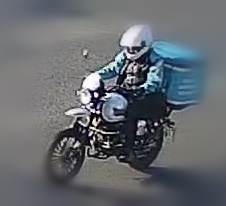
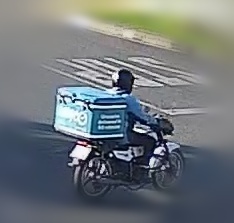
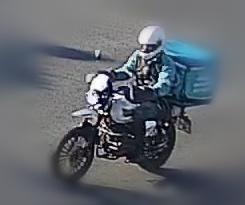
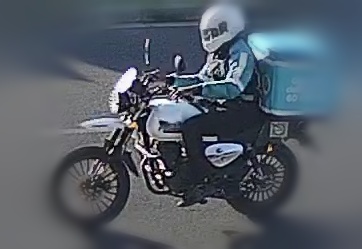
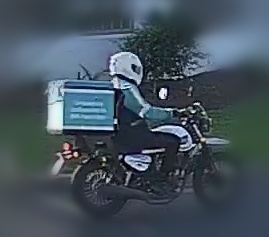
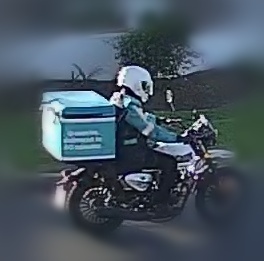
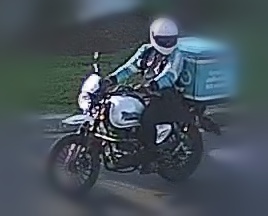
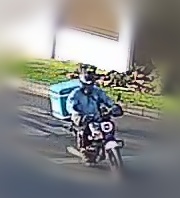
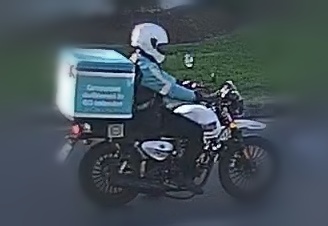
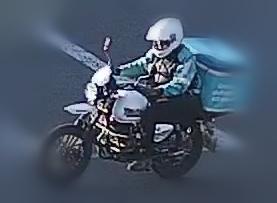
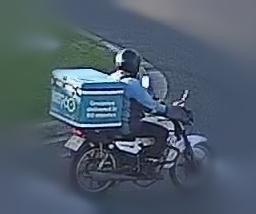
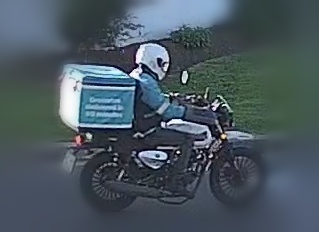
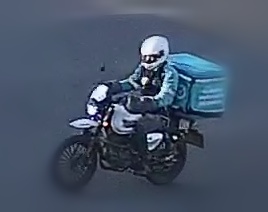
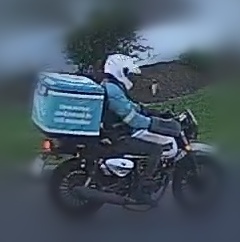
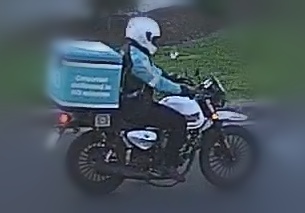
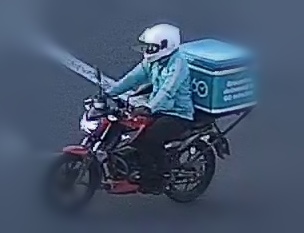
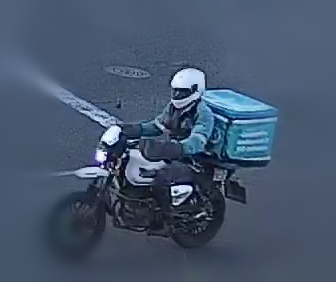
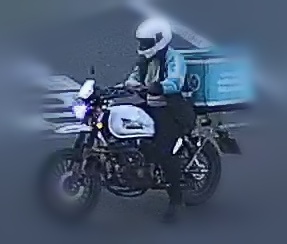
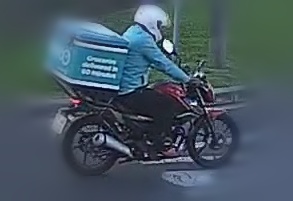
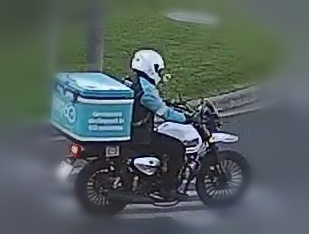
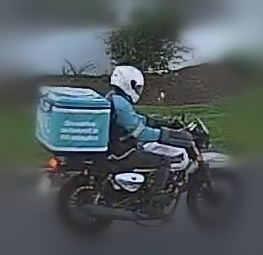
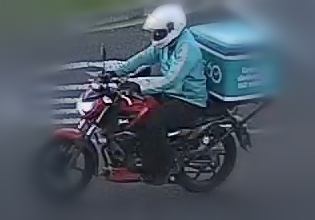
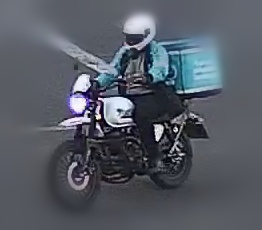
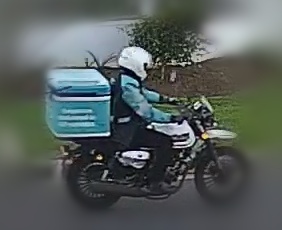
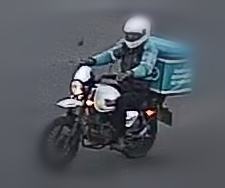
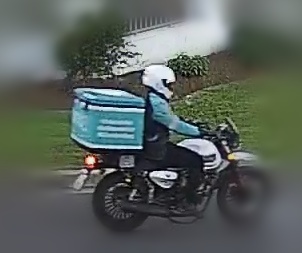
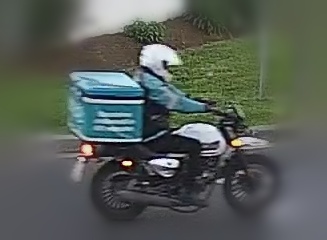
One blurred crop per detected crossing, in time order. Missed passes and everything after 18:00 are not pictured.
Jump to another day
Crossings are deduplicated per bike and classified before syncing. Crops avoid faces and full number plates, and each is edge-blurred to obscure surrounding people, vehicles or identifying details. See the methodology and privacy policy.