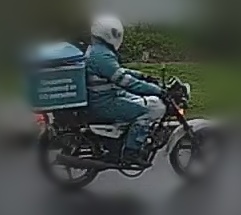
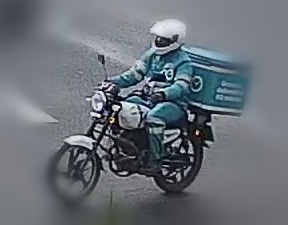
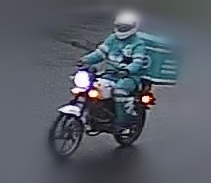
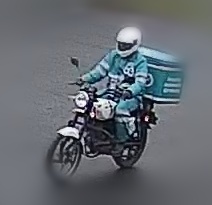
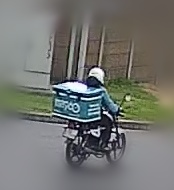
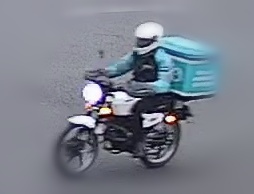
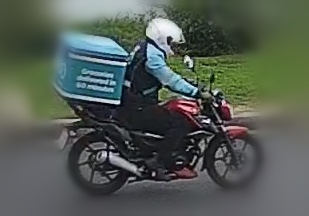
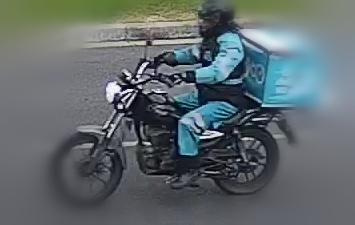
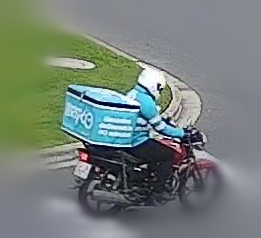
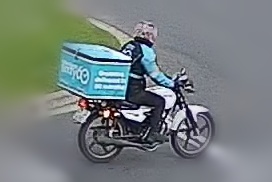
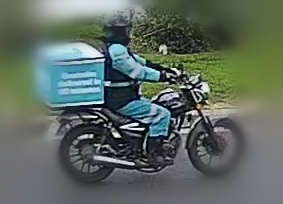
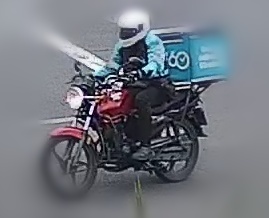
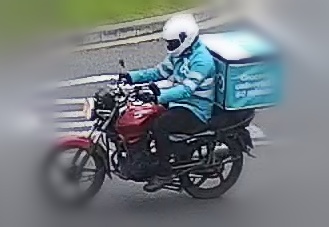
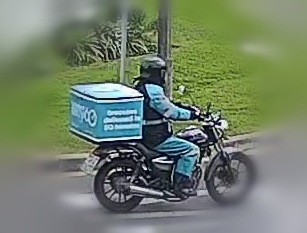
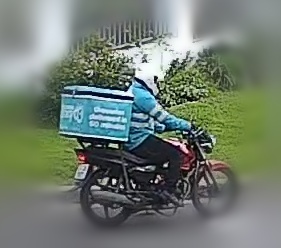
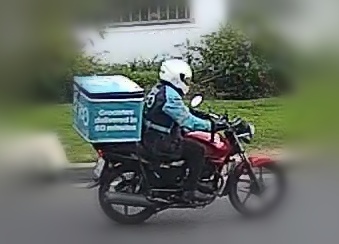
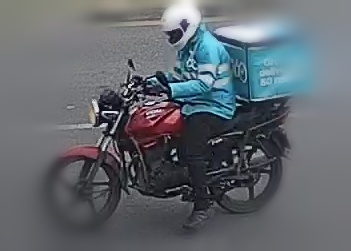
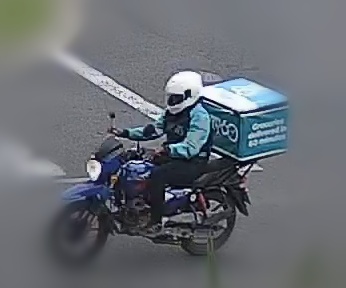
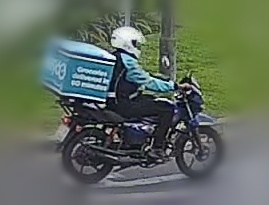
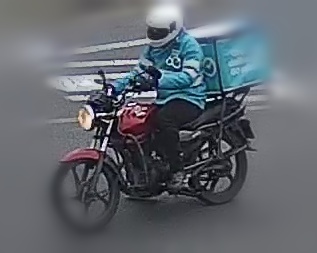
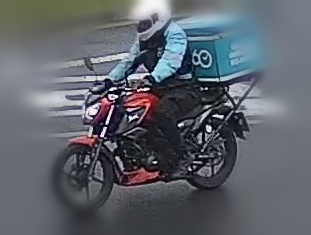
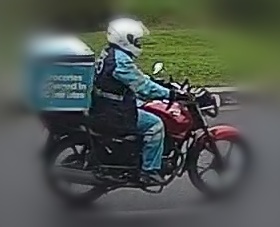
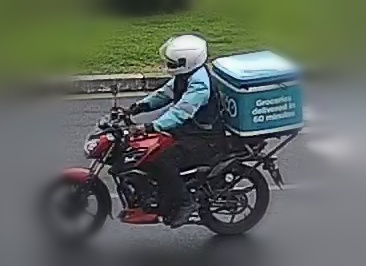
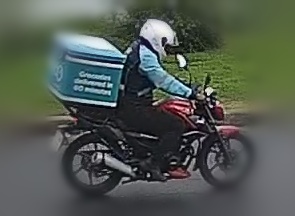
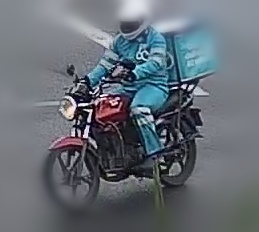
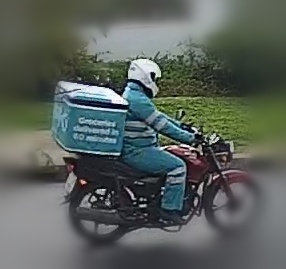
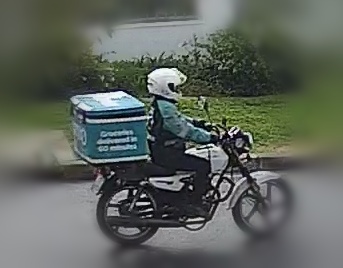
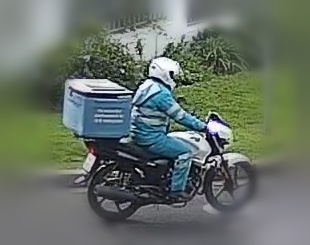
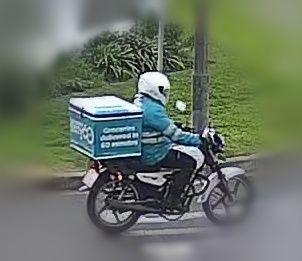
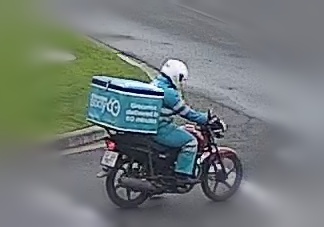
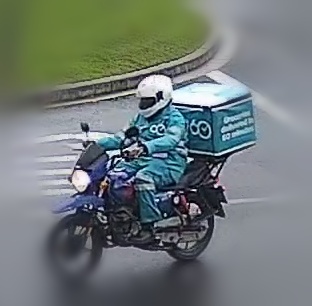
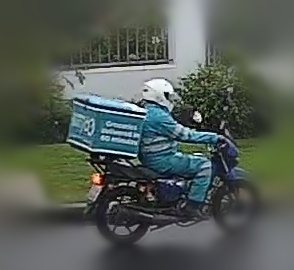
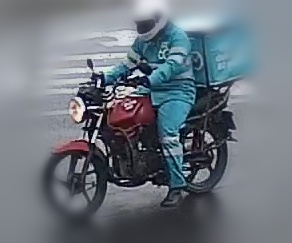
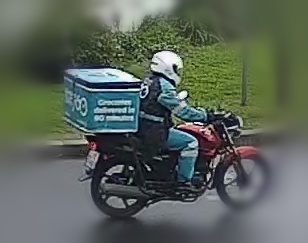
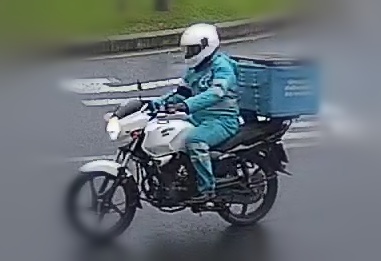
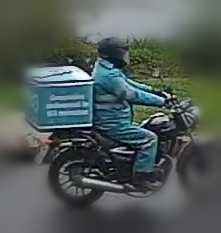
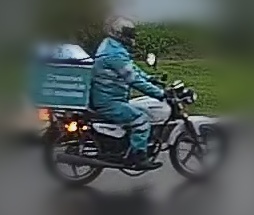
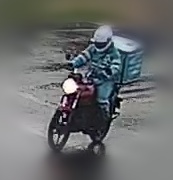
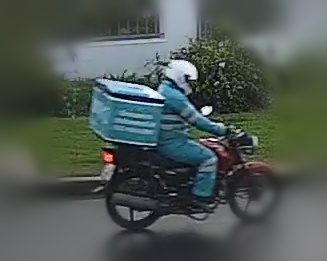
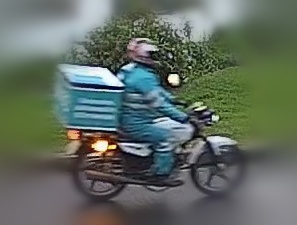
Counts of Checkers Sixty60 delivery-bike crossings through one residential point,
recorded over the most recent 36 recording days (1 Jun 2026 to 10 Aug 2026) by a camera detection pipeline. Each crossing is one deduplicated bike, with a
representative crop and, where recorded, a short audio clip. Every figure on this page is a
detected minimum from the 08:00 to 18:00 camera window only, not a full
daily total.
A Checkers Sixty60 delivery motorbike passes
every ~3.6 minutes
from 08:00 to 20:00, every day.
On the busiest recorded day (12 Jul 2026) that was one pass
every ~2.6 minutes. Estimated from camera-proven counts using the
published method below; the proven minimums anchor every figure on this page.
≈7 201estimated passes, last 36 recording days4 885 proven on camera
≈200estimated per day, average136 proven average
≈277busiest day (12 Jul 2026)184 proven on camera
Passes per day: proven vs estimated
1 Jun 2026 to 10 Aug 2026
Click any bar to open that day's detail below. 👇
Solid bars are camera-proven detected minimums (08:00 to 18:00). Striped segments extend
each bar to the estimated realistic total using the published method: the observed 75% to
80% detection rate plus a modelled 18:00 to 20:00 evening window. Estimates are modelled,
not observed.
Selected day: 8 Jun 2026
≈179 estimated passes · 123 proven on camera
By hour: proven vs estimated
8 Jun 2026, local time, evening modelled
Solid bars are camera-proven detected minimums. Striped bars are modelled estimates
(detected count adjusted for the observed 75% to 80% detection rate). The 18:00 and 19:00
bars have no solid partner because nothing after 18:00 can be proven on camera: they are
modelled as 65% and 35% of this day's 17:00 hour.
Loudest passes on 8 Jun 2026
top 20 by peak loudness
1
12:25peak -1.0 dBFS · avg -26.6 dBFS
2
15:57peak -1.0 dBFS · avg -27.0 dBFS
3
14:16peak -1.4 dBFS · avg -21.8 dBFS
4
17:25peak -1.4 dBFS · avg -22.6 dBFS
5
13:54peak -1.4 dBFS · avg -24.8 dBFS
6
17:34peak -1.4 dBFS · avg -25.0 dBFS
7
10:31peak -2.7 dBFS · avg -23.3 dBFS
8
16:37peak -2.7 dBFS · avg -28.6 dBFS
9
13:46peak -3.1 dBFS · avg -23.5 dBFS
10
10:39peak -3.5 dBFS · avg -27.6 dBFS
11
07:59peak -4.4 dBFS · avg -24.3 dBFS
12
15:42peak -4.8 dBFS · avg -26.1 dBFS
13
15:12peak -4.8 dBFS · avg -26.8 dBFS
14
15:53peak -5.8 dBFS · avg -23.8 dBFS
15
17:08peak -5.8 dBFS · avg -25.4 dBFS
16
09:07peak -5.8 dBFS · avg -26.5 dBFS
17
16:56peak -5.8 dBFS · avg -27.8 dBFS
18
17:20peak -5.8 dBFS · avg -32.4 dBFS
19
13:29peak -6.2 dBFS · avg -24.4 dBFS
20
08:51peak -6.5 dBFS · avg -26.2 dBFS
Loudness is relative (dBFS, uncalibrated 8 kHz mic), not real-world decibels. Closer to 0 is louder.
Ranked by the single loudest instant; ties rank by average loudness.
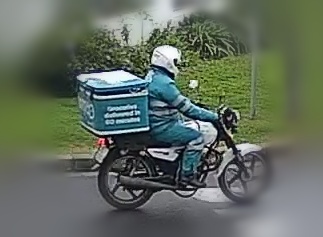
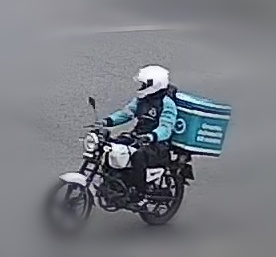
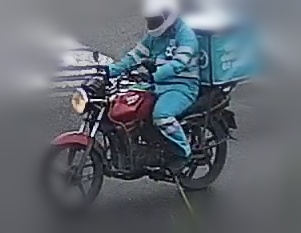
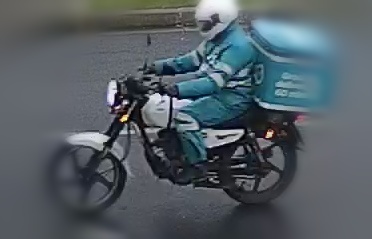
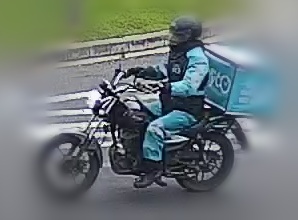
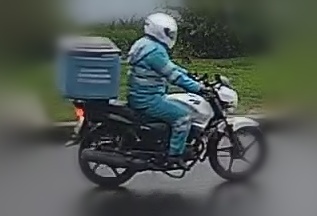
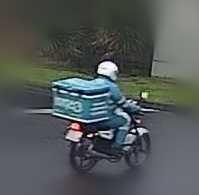
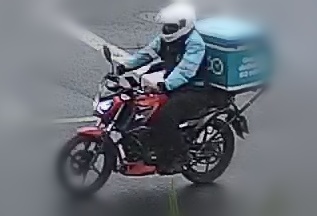
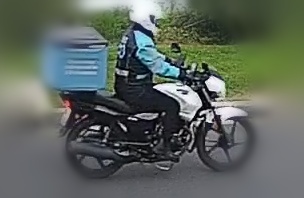
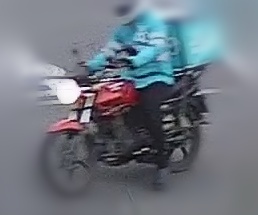
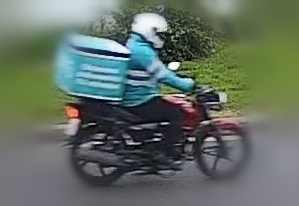
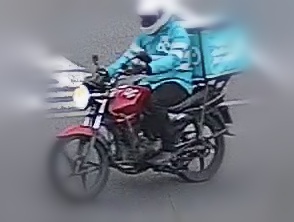
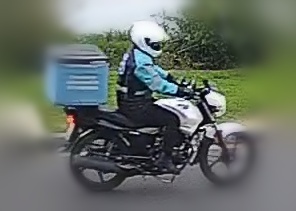
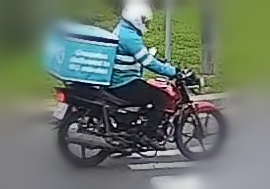
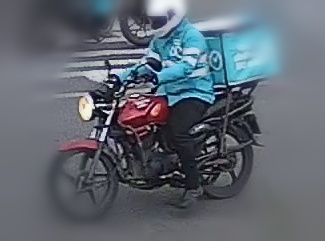
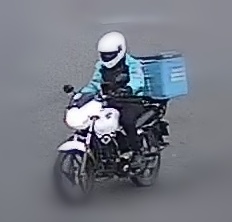
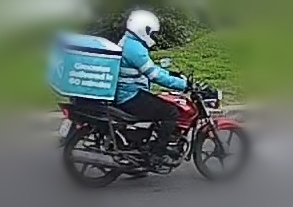
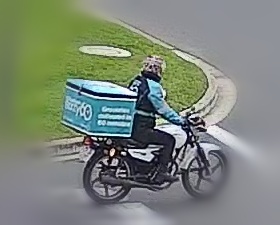
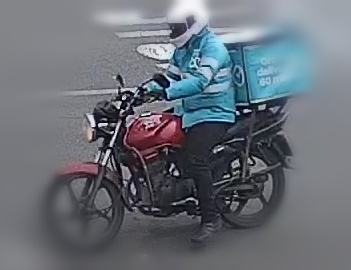
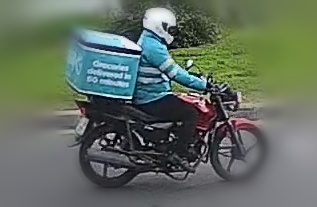
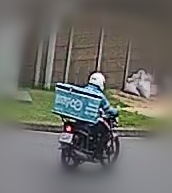
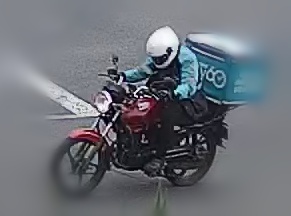
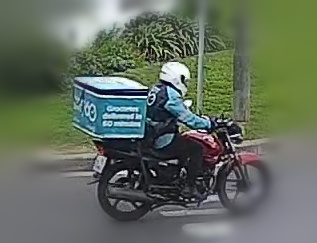
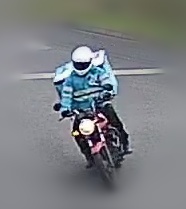
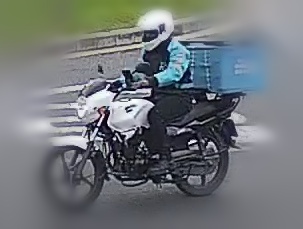
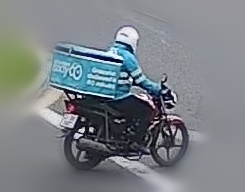
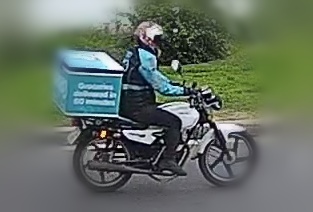
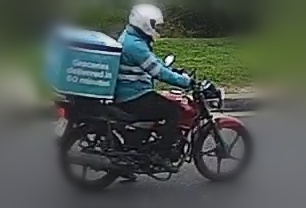
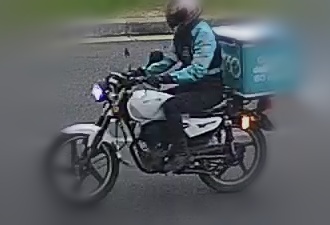
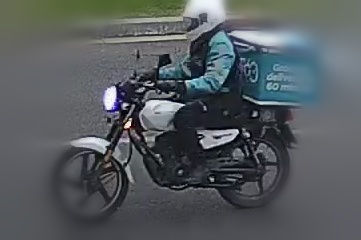
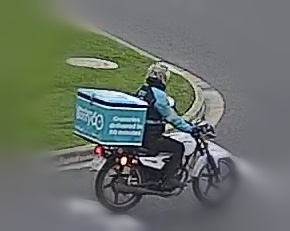
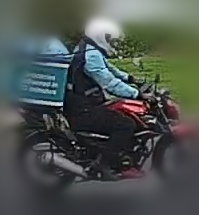
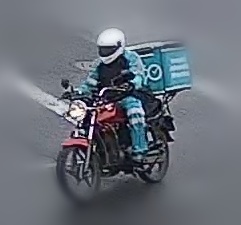
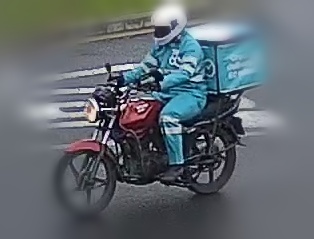
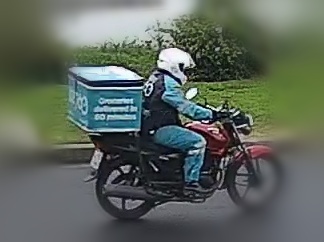
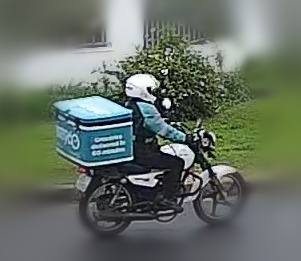
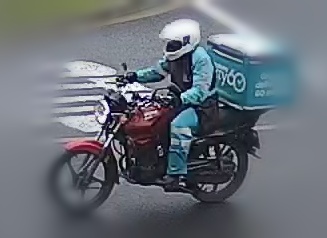
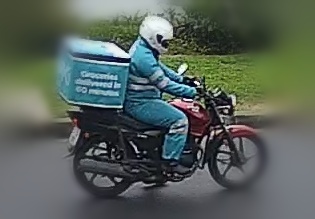
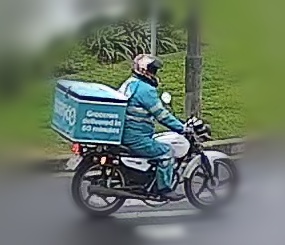
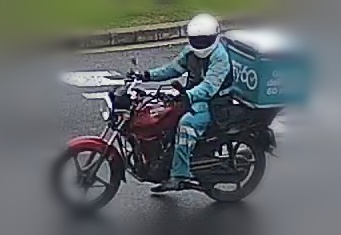
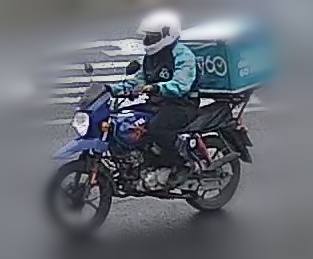
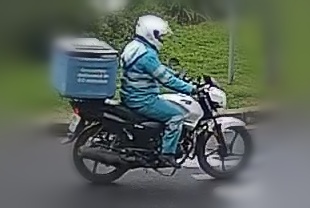
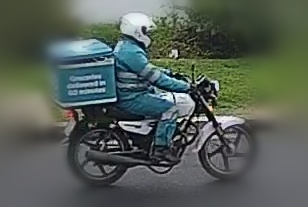
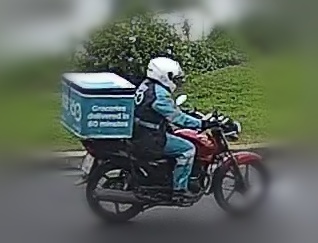
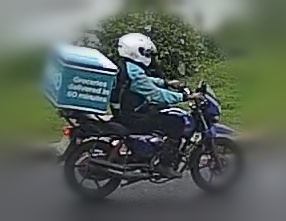
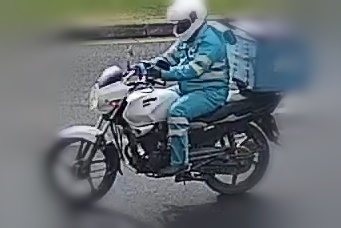
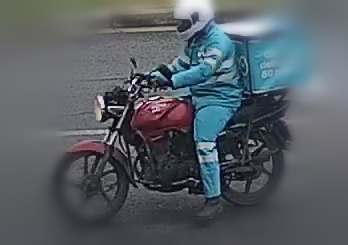
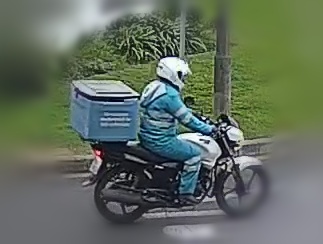
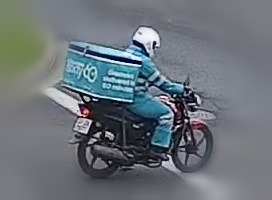
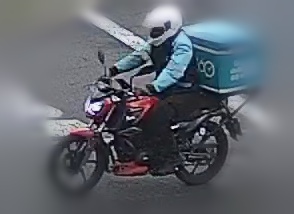
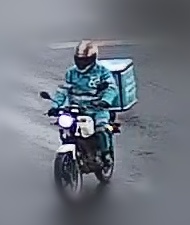
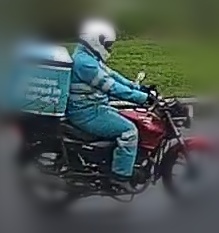
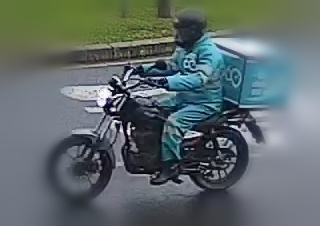
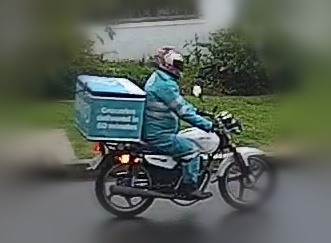
One thumbnail per detected crossing, in time order. Bikes missed by detection are not
pictured: fast blurred passes, extra bikes in simultaneous groups, and everything after
18:00. Listen to the loudest passes above.
Jump to another day
Order:
Crossings are deduplicated per physical bike and classified before syncing. No figure on this
page includes the 18:00 to 20:00 delivery period, missed fast stop-street passes, or extra
bikes in simultaneous groups; treat every number as a floor. A null audio clip means no
recording exists for that crossing (audio capture began on 27 May 2026). Crops avoid faces and full
number plates, and each crop is edge-blurred (sharp in the centre, blurred toward the edges) to help
obscure surrounding people, vehicles, or details that could be identifying. See the
methodology and
privacy policy.